How-to: Interaction tracking for your interactives
January 07, 2016
Up until now, my answer to the question 'Do you know what people are doing on your interactive pages' was 'No' or, in the case I didn't forget to include the Google Analytics code, 'Yes, but I only know page views and average time people spent on the page'. Not good practice, I know. So part of my professional New Years resolutions is better measuring what users do with the tools and interactives I build.
I'm lucky to have @RaphaelCockx as a colleague. He recently pointed me to Google Analytics Events. The door to the fun world of interaction tracking was kicked open.
Most sites already use Google Analytics to gather statistics on who is visiting what pages and where they came from. By adding just little bits of code to your interactive, you can very easily also monitor what buttons are clicked, where people are navigating to and what they entered in search fields for example, even when the user stays on the same page and the url of the page isn't changed.
As the GA Events docs specify, all you have to do is add the following snippet to your code:
ga('send', 'event', [eventCategory], [eventAction], [eventLabel])
In the wild
Let's explain this with a real life example. I recently made 2015 in 365 images, an overview of the past year, with one image for every day of the year. It is the first application I set event tracking up for.
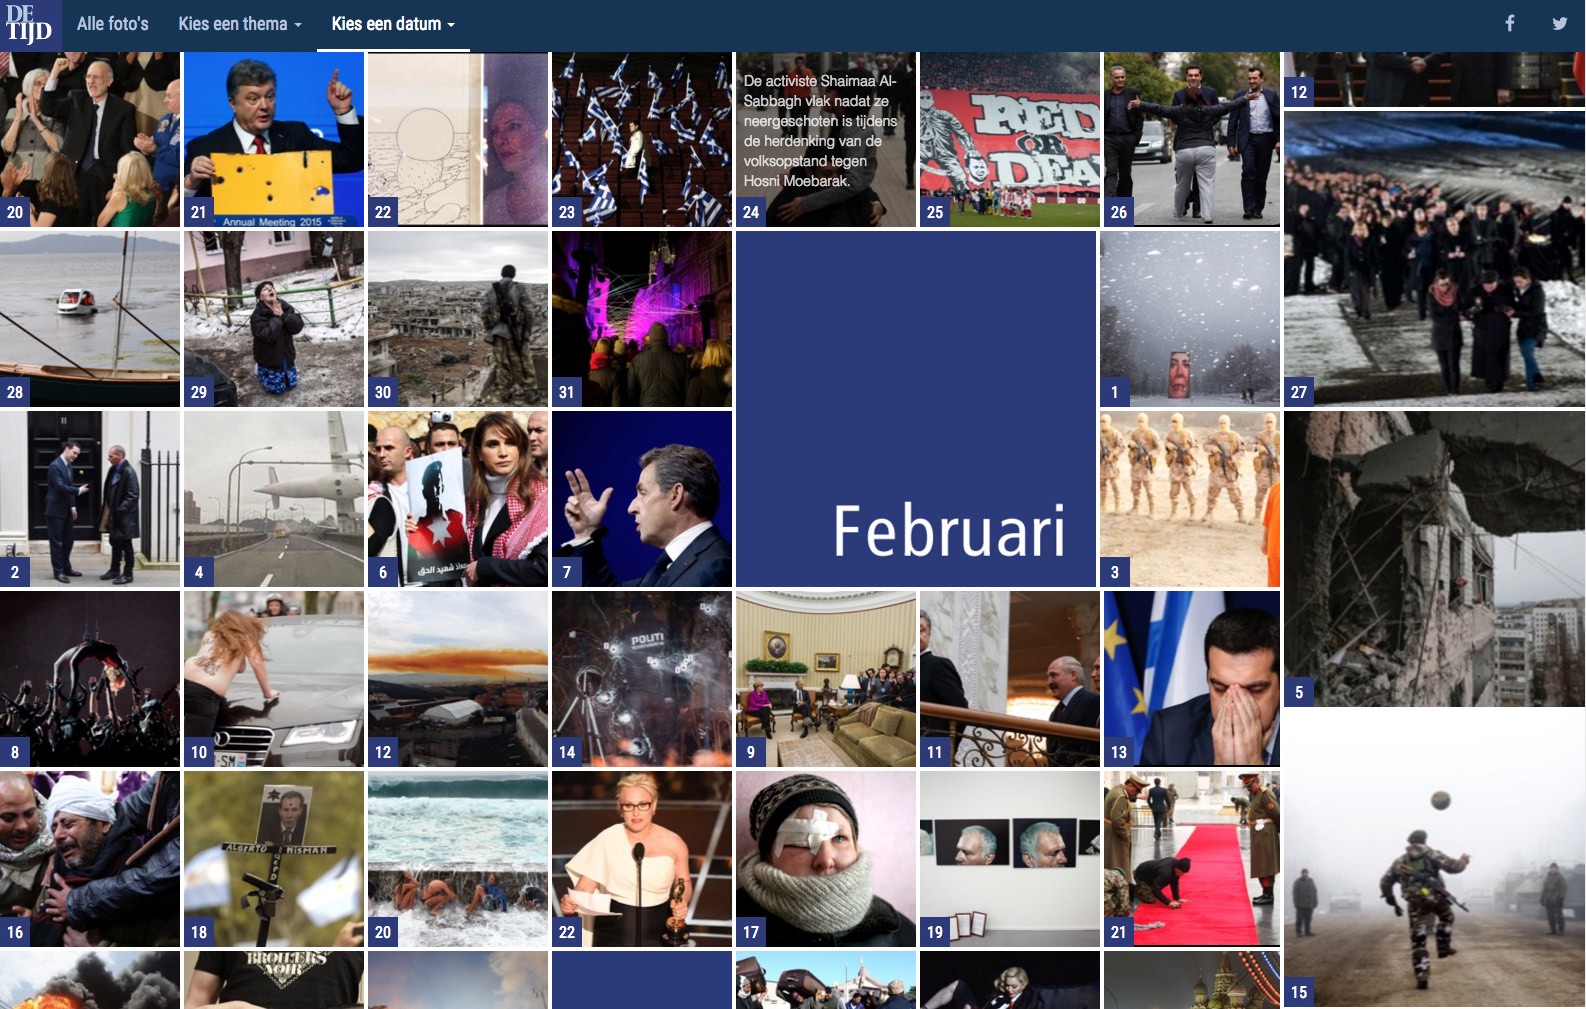
In the application, users can view large versions of the images in a slider by
- clicking a thumbnail of a specific day or by selecting a date from the datepicker
- arriving on the page via a shared link containing the datestamp of a specific image (example)
- navigating through the collection in the slider by swiping or navigating left or right
So I wanted to know
- how many pictures people viewed in the slider
- which pictures people viewed the most
- how they arrived at viewing the pictures
Firstly, I set the [eventCategory] to '365'.
ga('send', 'event', '365', [eventAction], [eventLabel])
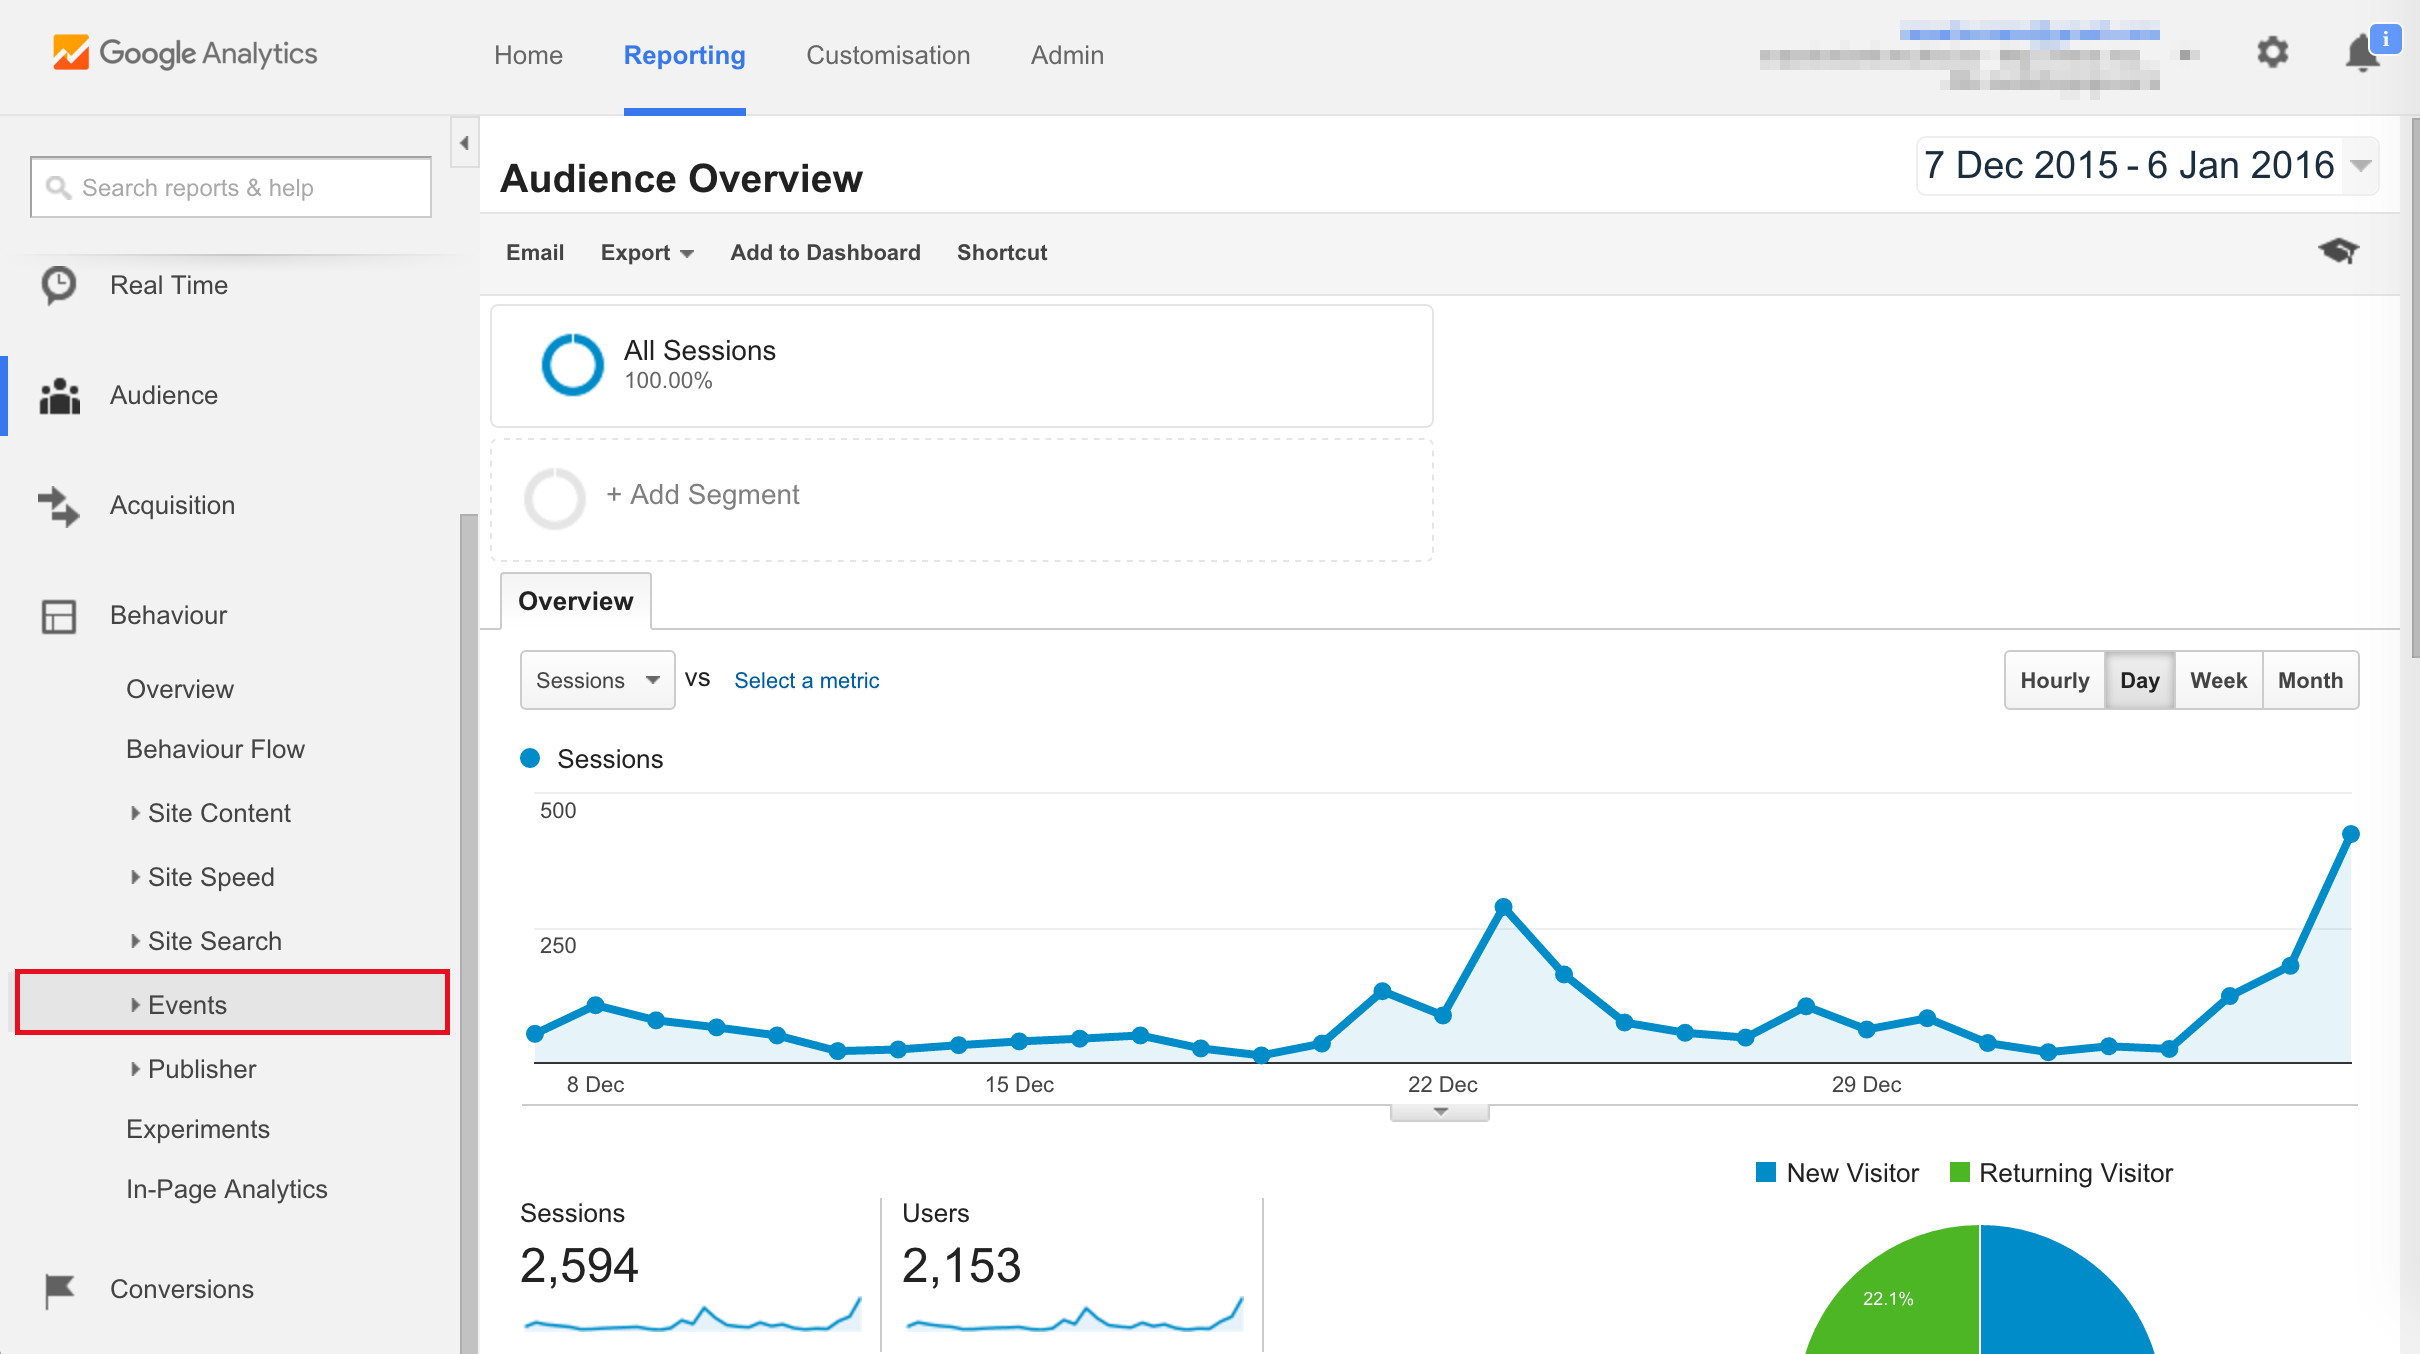
The event category is just a name to seperate the events you want to track from other events that might be configured on your site. When you're tracking, you can find all the events of a category under Behaviour > Events in Google Analytics.
For [eventAction], I choose to track the datestamp of the picture that was being viewed in the slider (something like 'pic20150413'). So every time a picture was viewed in the slider (after clicking a thumbnail, after arriving at the page with a datestamped url or by navigating left or right in the slider), a variable was set to the id of the picture and this variable was passed into the tracking code:
ga('send', 'event', '365', picID, [eventLabel])
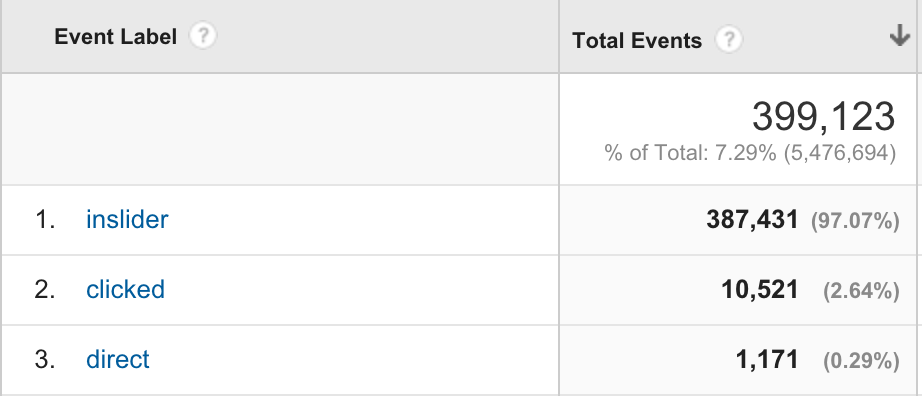
Finally, the event label is just an extra dimension of the events you can track. I set it to 'inslider', 'clicked' or 'direct', depending on how the user ended up viewing the picture (so I put this snippet in 3 different places in my code):
ga('send', 'event', '365', picID, 'inslider')
As I understand it well, I could have switched the event actions and labels: they are just dimensions to slice your tracking data.
The results
It turned out people liked navigating the slider a lot: 97 percent of picture views were generated by navigating left or right in the slider.
People kept on navigating for quite some time: average number of photos viewed per pageview was 43 and average time on site was a whopping 25 minutes.
The most clicked image by far (18 %) was the one from January 1st. So a lot of people just went in from the start. Other higher than average clicked images are fearful (3rd of February), spectacular (4th of February) or funny (2nd of July)
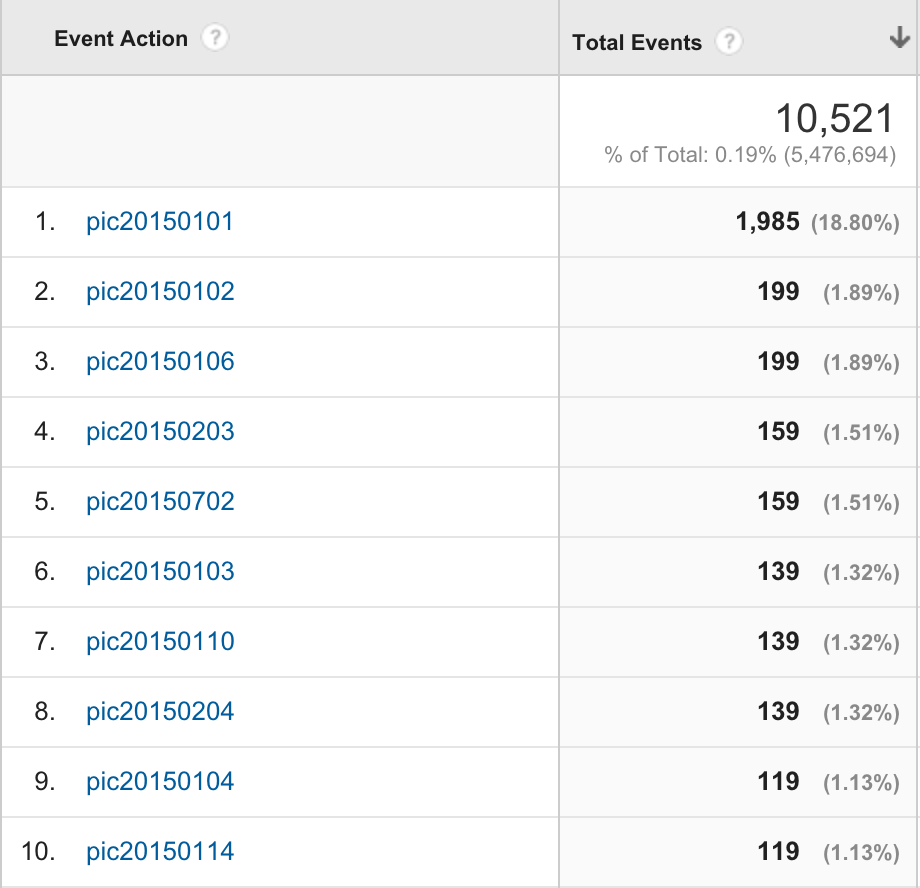
As a lot of people started navigating the collection in the slider from the first images, the top 20 most viewed pictures in the slider were all from January. The first picture not from January or February is only ranked number 50.
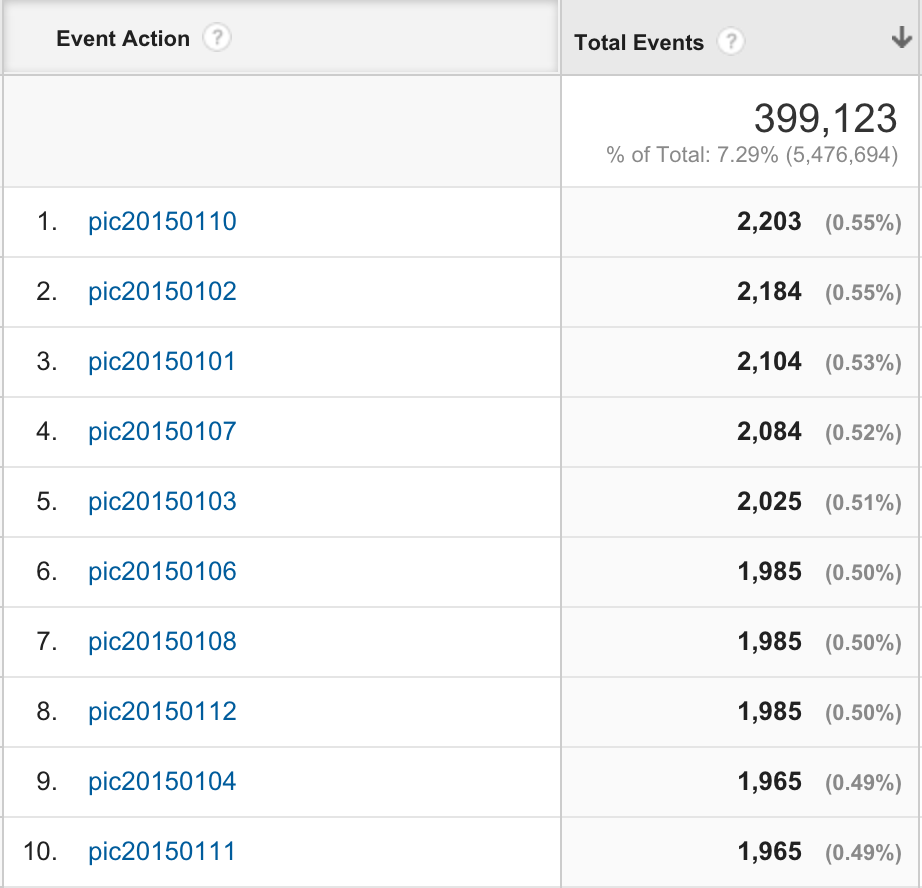
A little over 1000 images were viewed by arriving on the page with a datestamped url (only 0,29 % of the almost 400.000 images viewed)
So if I would decide to remake the same application next year, I might
- optimize swiping through the collection in the slider (not that smooth at the moment), as this is by for the most used interaction.
- come up with a way to arrange the pictures a little differently, so that pictures from later in the year are more likely to be clicked.
- maybe leave behind the feature of having datestamped url's for every picture, as it is an underused feature. Or come up with some ways to make people use this feature more.
So, what are you going to track?