Interactive strip plots for visualizing demographics
November 30, 2015
A lot of links connect the Paris terrorist attackers to the Brussels municipality of Molenbeek. As a consequence Molenbeek attracted a lot of attention from media worldwide.
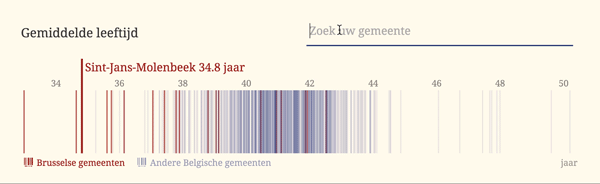
I knew that a lot of the Molenbeek sociodemographic statistics are outliers in the Belgian context. Even compared to other Brussels municipalities, the Molenbeek statistics are special.
So I decided to visualize the special characteristics of the population of Molenbeek and give the (Belgian) reader the possibility to make the comparison with their own municipality.
I chose 9 statistics (average age, average income, percentage of the population born abroad, ...), and decided to make a visualization for each of them. I wanted to include all the 589 Belgian municipalities to contextualize Molenbeek. It was clear the visualizations had to be dense, because they couldn't take too much space (9 of them needed to fit in one article) and would contain a lot of datapoints.
I deliberately decided not to make maps (all tough a map is included at the beginning of the article, just to situate Molenbeek). I wanted to show the distributions and the position of Molenbeek in each statistic, which can't be done with choropleth maps.
As Brussels has very different demographics than the rest of the country, I decided to highlight the Brussels municipalities by using a differentiating color. I used transparency to show the distribution of each statistic: areas on the graphs with high density of municipalities show up darker then areas with lower densities.
Municipality names and values are shown when hovering over the charts. I added a little bit of animation in there to make interaction a little more natural.
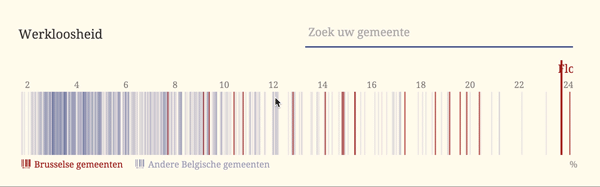
Lastly a searchbox with autocomplete makes it really easy to find a municipality of interest.
To make the charts fit well in our website, the graphs had to be designed for widths ranging between 540 and 924 pixels. So they are designed to be responsive (altough they do not respond to resizes).
Techniques
The 9 graphs are hosted as 1 page that takes a url-parameter for selecting a specific statistic.
http://multimedia.tijd.be/molenbeek/index.html?unemployed
As each statistic has its own text elements (title and units) and because some configuration of the charts is different for each statistic (rounding numbers, axis label formatting), I put together an array of config parameters. Chart configuration is picked by the url parameter.
var dataconfig = [{
  stat: "unemployed",
  title: "Werkloosheid",
  units: "%",
  perc: true,
  thousands: false
},
{
  stat: "density",
  title: "Bevolkingsdichtheid",...
Than we can select the right configuration from the url:
var statistic = window.location.search.substring(1);
var statconfig = dataconfig.filter(selectstat(statistic))[0];
The data is stored in a csv and D3.js is used to produce the line plot. The animation effect when hovering the chart is generated by using a little transition().duration(100) on the growing and shrinking of the lines, on the location of the tooltip and on the opacity of the tooltip. This makes the charts a little 'softer' to interact with.
lines.on("mouseover", function(d) {
  d3.select(this)
   .transition().duration(100)
   .attr("y1",0)
   .style("stroke-width", 3)
   .style("opacity", 1);
}
To avoid the tooltip content being cut of on the edges of the plot, the location of the tooltip switches side from the hovered line in the middle of the graphic. This is achieved by switching the text-anchor attribute of the svg text element that contains the tooltip info between "start" and "end" depending on the location of the mouse left or right from the middle of the plot.
if (x(d.value) > width/2) {
  tooltip.attr("text-anchor", "end")
}
else {
  tooltip.attr("text-anchor", "start")
}
The autocomplete searchbox is made with Typeahead. An extra little snippet selects the first autocomplete suggestion when hitting the enter key (this is jQuery).
$('#typeaheadcontainer').on('keyup', function(e) {
  if(e.which == 13) {
    $(".tt-suggestion:first-child", this).trigger('click');
  }
});