Making-of: the counting treemap
June 24, 2015
In 2014 the Belgian region of Flanders exported for more than 290 billion € worth of goods. But, as is the case with all numbers running in the billions, for most people this is just an abstract amount of money that doesn't mean much. With a little interactive, I wanted to give our readers a sense of what those numbers mean. At the same time, I wanted to communicate how these exported goods break down in different categories.
A while back, I saw German export in real time and this was a great source of inspiration. Too bad I only had the value of the exported goods and not the number of items for each product. So I didn't go for individual export products, but rather for a comparison of the categories. See the counting treemap of Flemish exports here (in Dutch). There is also a version for Walloon exports, in French.
Here is the gist of it, in a gif.
Treemap
No better way for representing the export data than a treemap, I think (accept for the traditional bar chart, of course). For a first sketch, I used RAW to see how the basic structure of the treemap would look like.
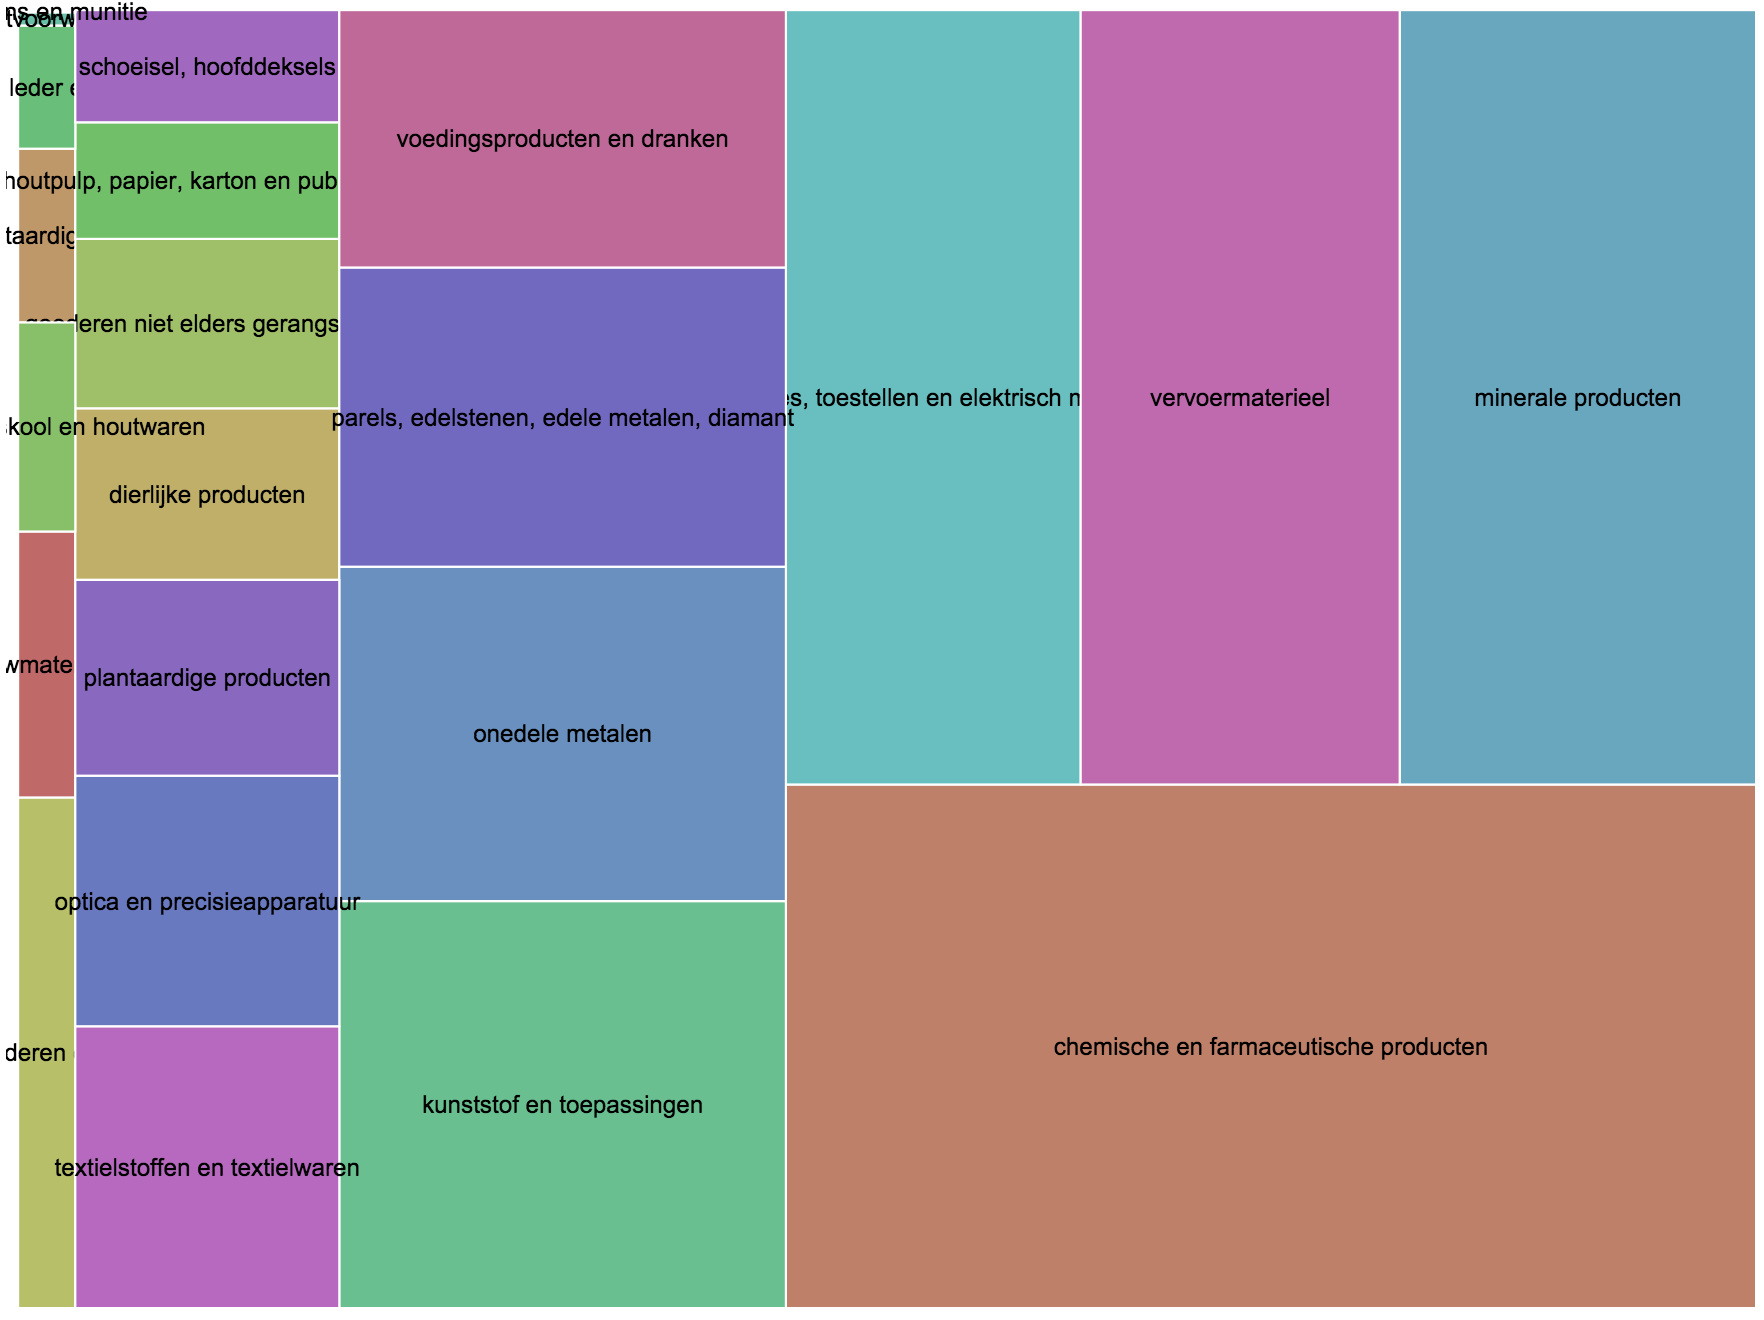
A nice bonus of RAW is that it gives you the option to export your data as a .json file. So RAW is a pretty easy tool for converting your csv or Excel data into json. It will even create a hierarchy for you in the data, with parent and children nodes if needed.
Then, as a second starting point, I used this D3.js example. I stripped the radio buttons out. I didn't have child nodes in my data (the subdivisions of the main blocks of the treemap), but I didn't need to change any code for the treemap to work without them.
Icons
I wanted to give each node an icon to illustrate a little what each category represents. I checked the the icons of my source of inspiration and was pleasantly surprised to discover Flaticon, 'the largest database of free vector icons'.
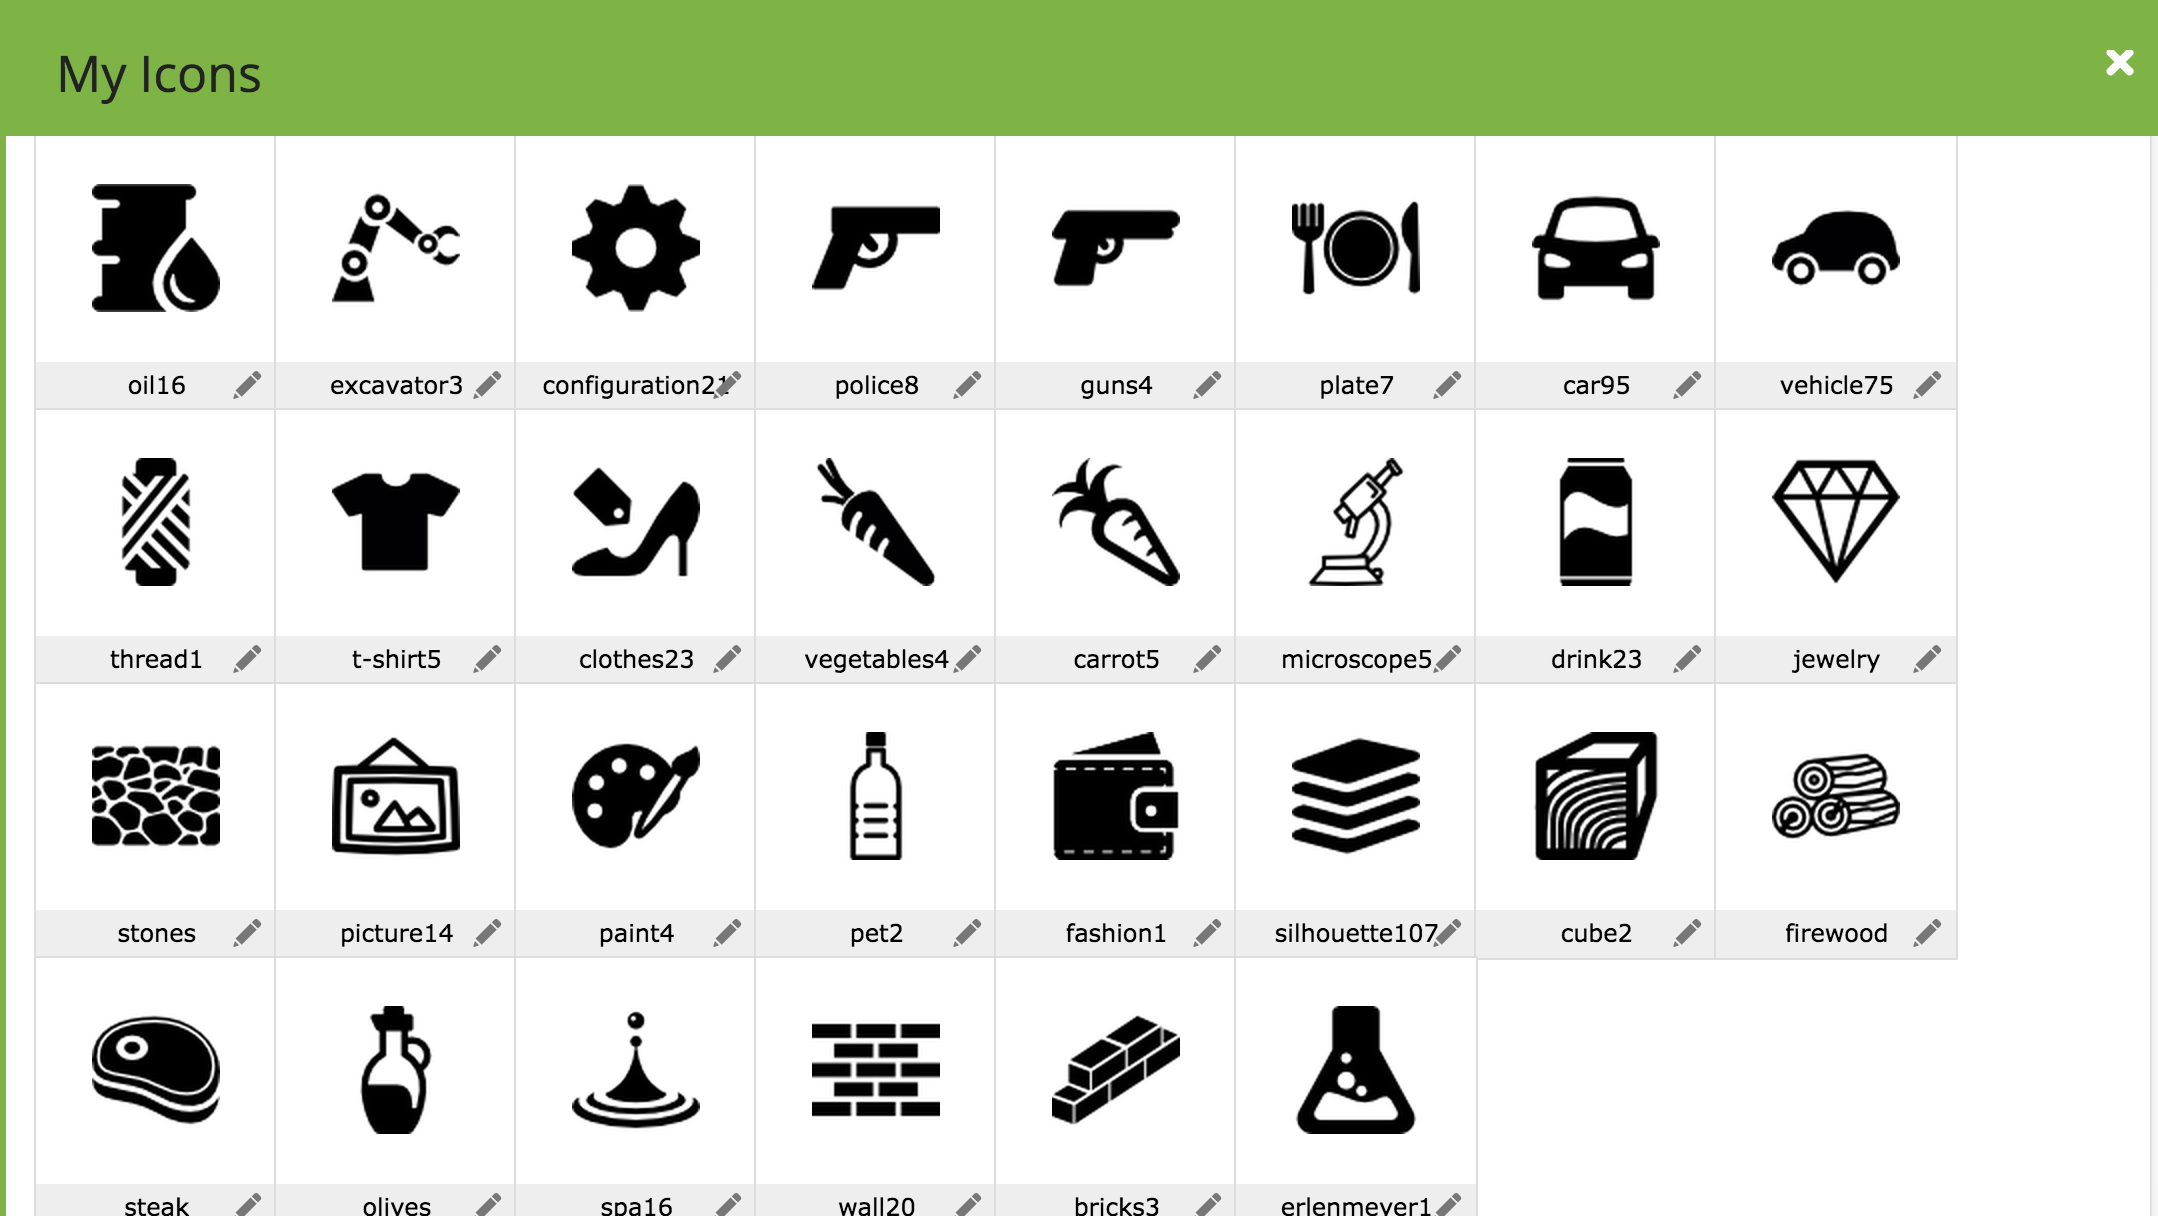 My Flaticon selection for the treemap. For some categories I selected multiple icons, to see which ones worked best.
Finding an icon for every category wasn't really hard. And the best part: you can use a webfont to display the icons. Which means you can easily scale icons: just set the font-size in css or in the javascript. And more importantly: centering the icons horizontally (in css: text-align: center;) and vertically (by setting the line-height to the height of the containing node of the treemap) is also easy.
Countalization
I'm a fan of 'Since you opened this page'-type of counters: they succeed in communicating big numbers in a very efficient way. A good example is The Internet in Real Time, but there are a lot of similar 'countalizations' online.
To let the numbers run, I used for every export category
- 2 html5 data-attributes, for storing the current number and the number to increment the current number with
- a javascript setInterval to calculate a new number every 100 milliseconds
I also used Accounting.js for formatting numbers.
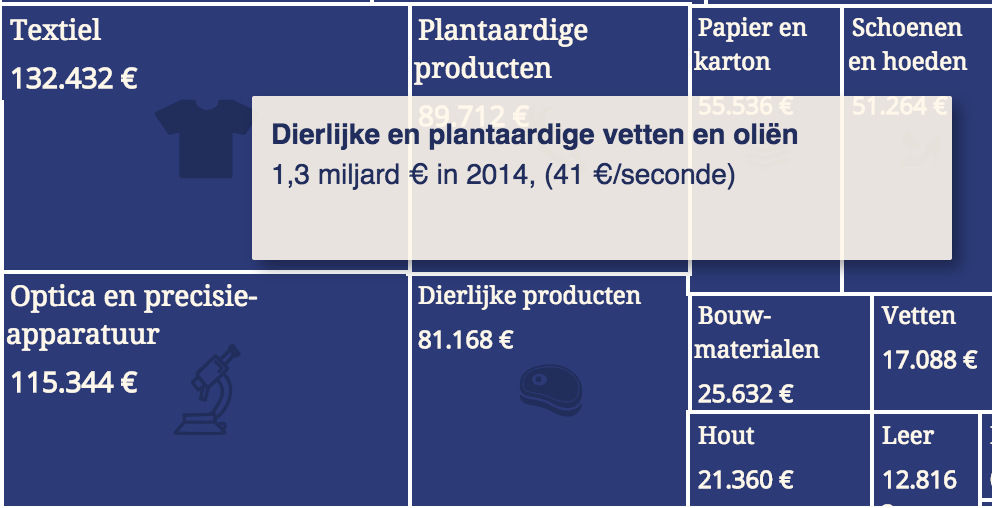
Tooltip
The tooltip that provide extra information for every category when clicked or tapped on were based on this treemap code. The most important change I made was to make sure that the tooltip always shows within the outline of the treemap. I also made the tooltip slightly transparant, so there is always a visual clue of what is behind the tooltip.
What do you think?
So what do you think of this counting treemap? Be sure to let me know if you like it or if you see possible points for improvement.